Overview
gnss-toolkit is a Python suite for characterizing GPS/GNSS receivers end to end. It
captures raw NMEA output from Telit-based modules, derives the metrics that actually
describe receiver performance, and renders publication-ready accuracy plots — as a CLI or
a Tkinter GUI.
The problem
GNSS bring-up and validation generate streams of NMEA sentences that mean little until they’re reduced to the numbers a datasheet cares about. Doing that by hand per test is slow and inconsistent. This toolkit standardizes capture → metrics → plot so results are repeatable and comparable across antennas, receivers, and sky conditions.
What it does
Two scripts cover the workflow:
gnss_logger.py— resets and powers on the GNSS engine (send_resetdoes cold / warm / hot via AT command), enables NMEA output (enable_nmea), and logs raw sentences to file (capture_nmea, default 900 s).gnss_nmea_analysis.py—parse_nmeaextracts time, fix quality, lat/lon, HDOP, and satellite count; ahaversinedistance against a reference position yields the metrics;mainwrites a CSV plus the plots.
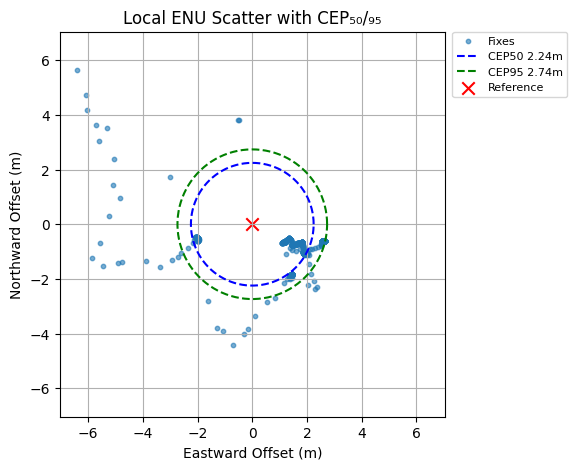
Metrics computed: TTFF (cold/warm/hot, as captured), CEP₅₀ / CEP₉₅, and RMS error. Outputs are written alongside the NMEA log as CSV + PNG figures (scatter and accuracy plots).
Tech
Python with pyserial (capture), pandas / numpy (analysis), and Matplotlib (plots); a Tkinter GUI wraps the analysis.
Get it
Source and usage are on GitHub.