Overview
RFlect turns raw antenna-measurement data into clear, publication-quality results. It ingests files from anechoic-chamber systems and network analyzers and produces 2D/3D radiation-pattern plots, efficiency analysis, and total-radiated-power (TRP) calculations — the day-to-day deliverables of antenna characterization, without wrestling with one-off scripts each time. It runs as a desktop GUI and as an MCP server that exposes the same analysis core to AI assistants.
The problem
Chamber and VNA exports are rarely presentation-ready. Engineers end up re-writing the same plotting and math — polar patterns, gain vs. angle, efficiency, TRP — for every test campaign. RFlect packages that pipeline into one tool with consistent, repeatable output so results are comparable across builds and easy to drop into a report.
What it does
- Parses measurement data from antenna chamber systems and network analyzers
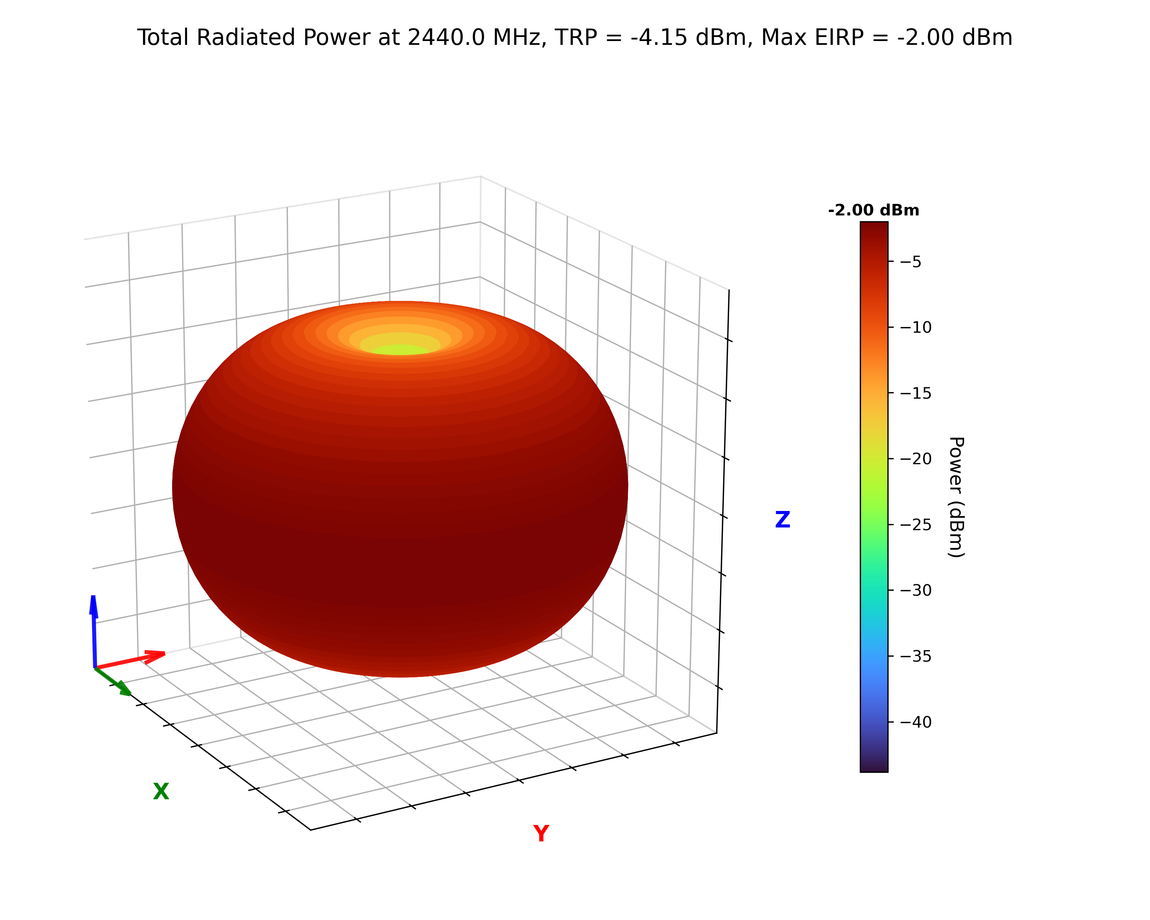
- Generates 2D and 3D polar radiation-pattern plots
- Computes efficiency, TRP, directivity, S11/VSWR, and axial ratio
- Produces branded DOCX reports with embedded plots and gain tables
Now: a 41-tool MCP server
As of v5.0.0, RFlect ships a Model Context Protocol server with 41 tools across nine categories (import, analysis, RF analysis, calibration drift, bulk processing, UWB, reports, orchestration, validation). It’s zero-dependency — no outbound LLM/API calls, no API key. When driven over MCP, the AI agent is the LLM: RFlect computes the data and renders the plots deterministically, and the agent supplies the narrative. Point it at a folder of measurements and it can analyze them and author a full report.
I wrote more about the design and the MCP toolset in this post.
Tech
Python with NumPy for the math, Matplotlib for plotting, and a PyQt5 GUI, packaged with PyInstaller as a standalone app. The analysis math lives in pure functions that back both the GUI and the MCP server.
Heads-up on portability: RFlect is built around specific lab equipment — the Howland chamber’s WTL text exports (V5.02/V5.03) and Copper Mountain VNAs. The analysis and plotting are general, but other chambers / VNA models will likely need their file parsers adapted first.
Get it
RFlect is open source — releases, source, and usage docs are on GitHub.